
Ingrid Thompson (SASRI Knowledge Manager, GIS Specialist)
YSA Monitoring App
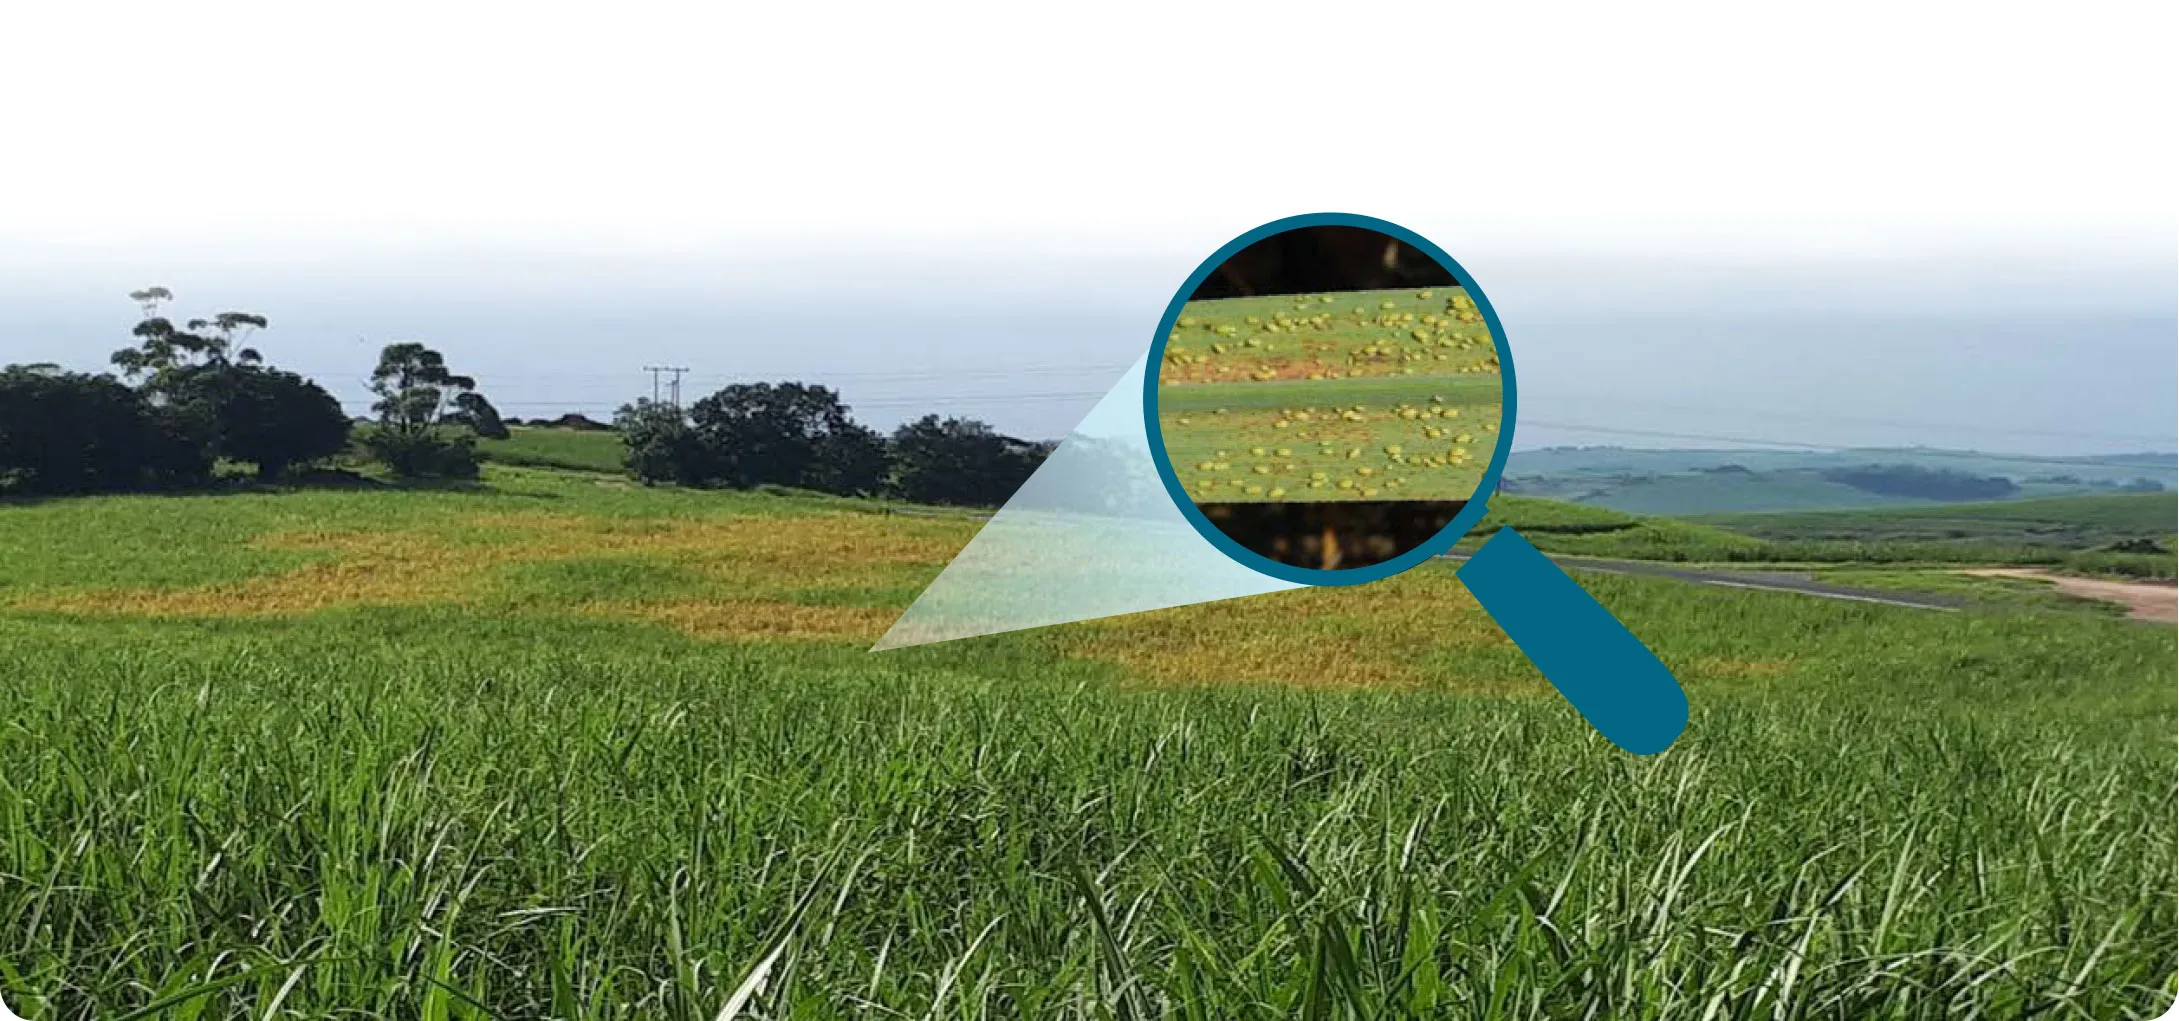
SASRI has developed an app which will allow growers to capture the severity of YSA presence and/or damage symptoms in-field, while simultaneously recording other field data such as variety and soil type. Data captured by all growers is stored on a central database at SASRI and displayed on the app in real time. This allows for more meaningful viewing and tracking where growers will be able to see the incidence of YSA presence and damage in relation to their own location.
Whilst the app was developed primarily for use by growers, it is also being used by Biosecurity Teams, SASRI Researchers, and Extension Specialists to log YSA presence and/or damage symptoms. It is hoped that many of you will use this app to monitor infestations on your own farms and in the local area.
Comprehensive training sessions will be held to assist growers set up and use the app. In the meantime, for those who feel adventurous enough, details on setting up and using the app are provided overleaf.
Using the App
Recording YSA incidence
- Install “ArcGIS Survey 123” from Google Play or the App Store.
- Open the app and select “Allow” to enable the app to take photos and videos.
- Select “Manage ArcGIS connections”.
- Select “Add Connection” and add the following URL: https://gis.sasa.org.za/arcgisportal.
- You should then see “SASRI GEOSPATIAL PORTAL” as an active connection.
- Use the back arrow at the top left to go back, and then select “Continue without signing in”.
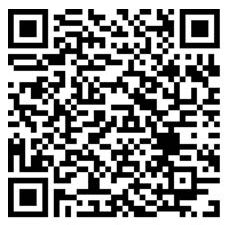
- Select the QR code icon in the search tab, then scan the QR code provided above.
- Wait for the form to download and optimise.
- Click on the form and select “Collect” at the bottom.
- Fill in all the details and submit by selecting the green tick at the bottom right of the screen.
Viewing the YSA incidence in my area
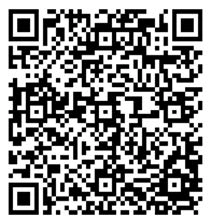
- Access the YSA App by scanning the QR code to the right or clicking this link: Open YSA App
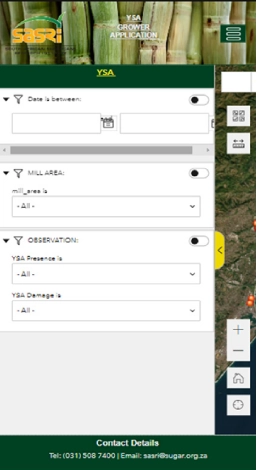
- You can show or hide the filter window by selecting the yellow tab.
- Fill in filter details for DATE, MILL AREA, OBSERVATION.
Each of these filters can be activated or deactivated by clicking on dot next to the filter title
The map will adjust according to the filters activated.
Additional features
Search bar: When the map is in full view, use the search bar to enter an address.
Zoom controls: Use the plus (+) and minus (-) buttons to zoom in and out on the map.
Locate button: The locate button can be used to find your current location.
Measure tool: Use the measure tool to measure distances on the map.
Menu: Click on the menu button at the top of the screen to access different screens, namely, Draw,
Elevation, Fields, and Graphs.

